Summary
- While stranger things have happened, this year’s big winners and the factor exposures that drove their returns were certainly atypical.
- Overall, the Ivies reversed the disappointing results of FY 2016, with all registering positive returns and all but Harvard beating the 60-40 portfolio (only the second time that’s happened since 2009).
- Traditional under-performers outperformed, while traditional outperformers posted more moderate returns.
- Public equity markets rallied strongly, beating private equity markets and boosting Ivy endowment returns.
- Harvard claims bottom performer status for the fourth time in six years and showed large negative unexplained returns (reportedly due, in part, to significant markdowns in its natural resources holdings).
- Endowments’ continued increase in exposures to illiquid investments, a move toward the Yale model of a high-risk, high-return portfolio, appeared to deliver no meaningful benefits in 2017.
Ivy League Endowment Assets
As of July 2017, the total AUM among the Ivy League endowments was $125.56 billion, representing 24.38% of the assets held by universities and related endowments [1]http://www.nacubo.org/Research/NACUBO-Commonfund_Study_of_Endowments.html. While final numbers for fiscal year 2017 are still pending, here is a look at how 2016 AUM was distributed across the Ivies.
| Endowment | FY 2016 AUM (in Billions) |
| Harvard | 37.10 |
| Yale | 27.20 |
| Princeton | 23.80 |
| Penn | 12.20 |
| Columbia | 10.00 |
| Cornell | 6.80 |
| Dartmouth | 4.96 |
| Brown | 3.50 |
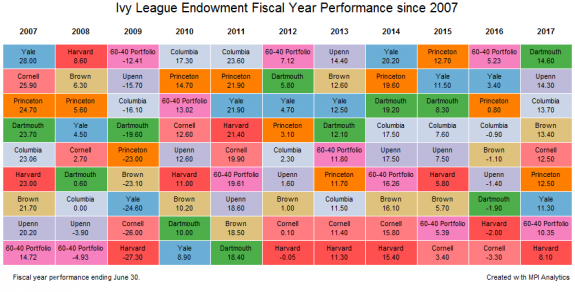
Performance
In stark contrast to FY 2016, this past year was a strong one for most endowments. In fact, nearly all the Ivy League endowments, Harvard being the only exception, beat the 60-40 portfolio, a commonly cited benchmark that endowments measure their performance against. Only Columbia and Princeton have beaten the 60-40, on average, over the past 10 years.
All endowments managed returns well above their historical payouts of 5%, even after adding 1.65% inflation. Dartmouth, with a return of 14.60%, beat the rest of its Ivy peers, continuing its fairly consistent trend of ranking among top Ivy performers. In fact, only Yale has performed as well as Dartmouth has during the last five years. University of Pennsylvania (UPenn) reversed course this year, ranking a close second with 14.30% returns. And Harvard continues its six-year trend of performing at or near the bottom of the class with 8.10% returns in FY 2017. Yale, which has landed in the top three every year since 2011, delivered mediocre returns this year, relative to its peers, at 11.30%.


By most measures, however, FY 2017 was an unusual year. In fact, Ivy endowments that have historically under-performed their peer group outperformed this year, with Brown and Cornell being the most notable examples. Both endowments beat perennial juggernauts, Yale and Princeton, this year, a feat we’ve only seen once since 2011. Much of this year’s outperformance can be attributed to larger exposure to public equities, which have seen a remarkable rise since Q4 2016.

Exposures
To capture exposures, we analyze each endowment return time series using a common factor set across all endowments, so that we ensure an apples-to-apples comparison. This enables us to create a factor-mimicking portfolio for each endowment that can provide further performance insight. Table 1 displays the factors we used to represent each of the asset classes found in the Ivy League endowment portfolios.
Table 1. Factor Proxies by Asset Class [2]We used preliminary data for the quarter ending on June 30, 2017, representing 61% of active funds updated compared to the prior quarter’s NAV for US Buyout and 68% for US Venture Capital.
| Asset Class | Factor |
| Bonds and Cash | Bloomberg Aggregate Bond |
| US Equity | S&P 500 |
| Foreign Developed Equity | MSCI EAFE* |
| Emerging Market Equity | MSCI Emerging Markets* |
| Real Estate | Cambridge Associates Real Estate |
| Private Equity | Cambridge Associates Private Equity |
| Venture Capital | Cambridge Associates Venture Capital |
| Natural Resources | Bloomberg Commodity |
| Hedge Funds | Eurekahedge 50 |
*USD based exposure, assuming no currency hedging
The analysis was conducted using our proprietary Dynamic Style Analysis (DSA) model. DSA is an enhanced (returns-based) quantitative analysis model that provides a more transparent view of opaque or complex investment strategies, funds and products.[3]DISCLAIMER: MPI conducts performance-based analyses and, beyond any public information, does not claim to know or insinuate what the actual strategy, positions or holdings of the funds or companies discussed are, nor are we commenting on the quality or merits of the strategies. This analysis is purely returns-based and does not reflect actual holdings. Deviations between our analysis and the actual holdings and/or management decisions made by funds are expected and inherent in any quantitative analysis. MPI makes no warranties or guarantees as to the accuracy of this statistical analysis, nor does it take any responsibility for investment decisions made by any parties based on this analysis. Through this model, we compared the returns of the endowments since 2005 to the factors shown in Table 1. The chart displays the asset class exposures obtained for all Ivy League endowments over the past 10 years.

Our factor mimicking portfolios are able to capture the majority of each endowment’s performance. The chart below depicts the cumulative returns of the endowments against the returns of the factor mimicking portfolios:

Performance Attribution

Exposure to Private Equity was the largest contributor to aggregate endowment performance in FY 2017. Additionally, Hedge Funds, US Equity, Venture Capital, Real Estate, Foreign Developed Equity and Emerging Markets also contributed positively to endowment performance. Natural Resources was the only major asset exposure to be a negative contributor to performance in FY 2017.
All public equities outperformed Private Equity in FY 2017. To put that into context, US Equity has outperformed Private Equity only five times since 2001, Developed Foreign Equity has done it six times, and Emerging Market Equity has out-performed 10 of those 17 years. All three out-performed Private Equity this year, just the second time that’s happened in the last 10 years. Additionally, Real Estate and Venture Capital were soundly beaten by public markets, adding to the under-performance of Yale, which had the highest Real Estate exposure, and Princeton, which had the highest Venture Capital exposure.
Looking at the differences in performance in the underlying asset classes and considering the exposure of endowments to these asset classes, it’s easy to see why the performance of FY 2017 was so different from FY 2016: markets, in general, performed well over the last 12 months.

In fact, all asset classes, except for Bonds and Cash, performed significantly better during FY 2017 than they did in FY 2016. The largest magnitude of difference can be seen in foreign equities. Developed Foreign Equities returned 30.42% more in FY 2017 than in FY 2016, and Emerging Markets returned 35.81% more.[4]Foreign equity returns are US Dollar based, and assume no currency hedging. The dollar currency index fell by .5% over FY 2017, indicating small gains from currency translation. Yale shows the lowest exposure to these asset classes; with Dartmouth, UPenn and Columbia (the three highest performing endowments) showing the highest exposure.
Unexplained Returns Explained
Clearly, our factor model is not expected to capture 100% of endowment returns variation. And while its explanatory power is high, as we noted in our previous studies and as evidenced by the cumulative growth chart above, we observe some unexplained returns every year. These unexplained returns could be due to security, sector, country, style and strategy bets by underlying managers for marketable securities as well as valuation fluctuations and adjustments for private investments.
Unexplained returns were mostly positive this year, with the exception of Harvard and Yale, hinting[5]This has to be carefully evaluated given the unexplained portion of the returns also contains noise. at the ability by the funds to earn abnormal returns over and above their asset allocations. Harvard, in particular, stands out with a negative -2.9% unexplained return after final analysis. In his 2017 fiscal year letter, Narv Narvekar, CEO of Harvard Management Company, pointed to a number of internal changes enacted during the year. Those included markdowns of Natural Resources; unloading of Private Equity, Venture Capital and Real Estate funds in the secondary market; and increased allocations to external managers.
It is important to note that markdowns that affect the performance of the endowment, which are not related to market performance, are captured as a negative unexplained return. It is also important to note that the large positive selection returns by other endowments this year could be a source of concern for the future, especially if related to similar adjustments to the values of illiquid investments.
Changes to Fund Exposures (Movement toward private investments)
The Yale model, pioneered by David Swensen, the manager of the Yale endowment, has swept through the endowment world. This model calls for increased investment in illiquid and higher risk assets in order to harvest the illiquidity premium. These investment properties are more easily sustained by endowments due to their having a larger asset base and a longer time frame than most institutional investors. Using our portfolios of exposure, we can see how investment portfolios have changed over time, especially focusing on illiquid private investments.

The chart above depicts the exposure of the endowments to private investments (Private Equity, Venture Capital, Real Estate and Hedge Funds). We can see that most endowments have increased their exposure to private investments since 2005, indicating broad adoption of the Yale model.
Conclusion
FY 2017 was an unusual year for endowment performance. Ivy League endowment returns were all positive, rebounding from a tough FY 2016. Traditional under-performers outperformed, with traditional outperformers posting more moderate returns. Public equity markets rallied strongly, boosting the returns of the Ivy endowments. Longer term trends show that endowments continue to increase exposures to illiquid investments, moving more toward the Yale model of a high-risk, high-return portfolio.
References
| 1. | ↑ | http://www.nacubo.org/Research/NACUBO-Commonfund_Study_of_Endowments.html |
| 2. | ↑ | We used preliminary data for the quarter ending on June 30, 2017, representing 61% of active funds updated compared to the prior quarter’s NAV for US Buyout and 68% for US Venture Capital. |
| 3. | ↑ | DISCLAIMER: MPI conducts performance-based analyses and, beyond any public information, does not claim to know or insinuate what the actual strategy, positions or holdings of the funds or companies discussed are, nor are we commenting on the quality or merits of the strategies. This analysis is purely returns-based and does not reflect actual holdings. Deviations between our analysis and the actual holdings and/or management decisions made by funds are expected and inherent in any quantitative analysis. MPI makes no warranties or guarantees as to the accuracy of this statistical analysis, nor does it take any responsibility for investment decisions made by any parties based on this analysis. |
| 4. | ↑ | Foreign equity returns are US Dollar based, and assume no currency hedging. The dollar currency index fell by .5% over FY 2017, indicating small gains from currency translation. |
| 5. | ↑ | This has to be carefully evaluated given the unexplained portion of the returns also contains noise. |


